Example 1
Running a Simulation and Storing Data^M
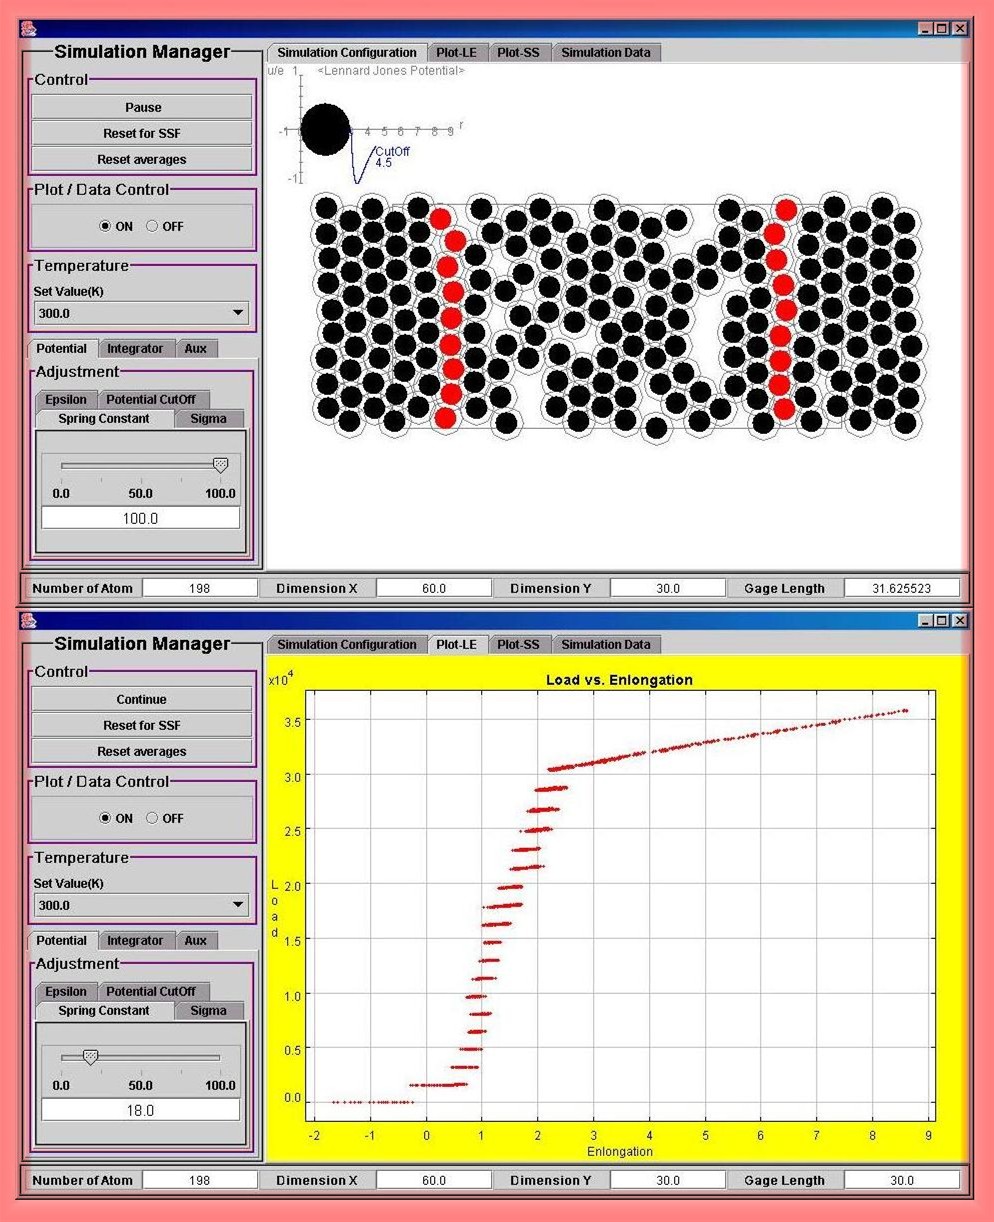
With the simulation loaded, select the AUX tab. Under this tab, select the potential cutoff and select the option as 'On' to show the cutoff raius and Lennard-Jones potential on screen. Then press the start button to begin the simulation. Once the simulation is running, every particles will move in a way to satisfy the equation of motion. With no external force, the user has to wait for the system to be reached to a initial equilibrium point. It might take a few minutes. At this point the user should turn on the Plot/Data Control option and the simulation will begin recording data. The user can see present data by clicking the pause button at any time while the simulation is running. The user should increase the spring constant by a value of one and wait for the system to equilibriate. The user can determine the equilibrium state by monitoring the gaze length to be in close range of values. The process of increasing the k value should be continued until a crack begins to form. A fracture point is determined when the potential cutoff circles of the atoms no longer overlap along the width of the specimen material. Once the fracture has formed, the user might want to look at the Load v. Elongation and Stress v. Strain graphs for further studies by clicking on the tabs in the top of the screen.